
Volume Profile Analysis Indicator (VPVR Indicator Tradingview or Thinkorswim)
Dec 23, 2021
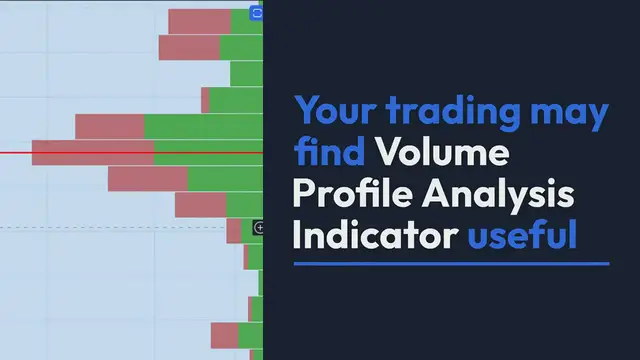
Volume Profile Analysis Indicator (VPI) is a volume-based indicator calculated by taking the volume of shares traded in price range and plotting it on a stock chart graph.
The VPI is one of the indicators used to find support and resistance pressure levels.
It can also be used to reveal breakouts, continuation patterns, early indications of trend changes, and more.
Show More Show Less