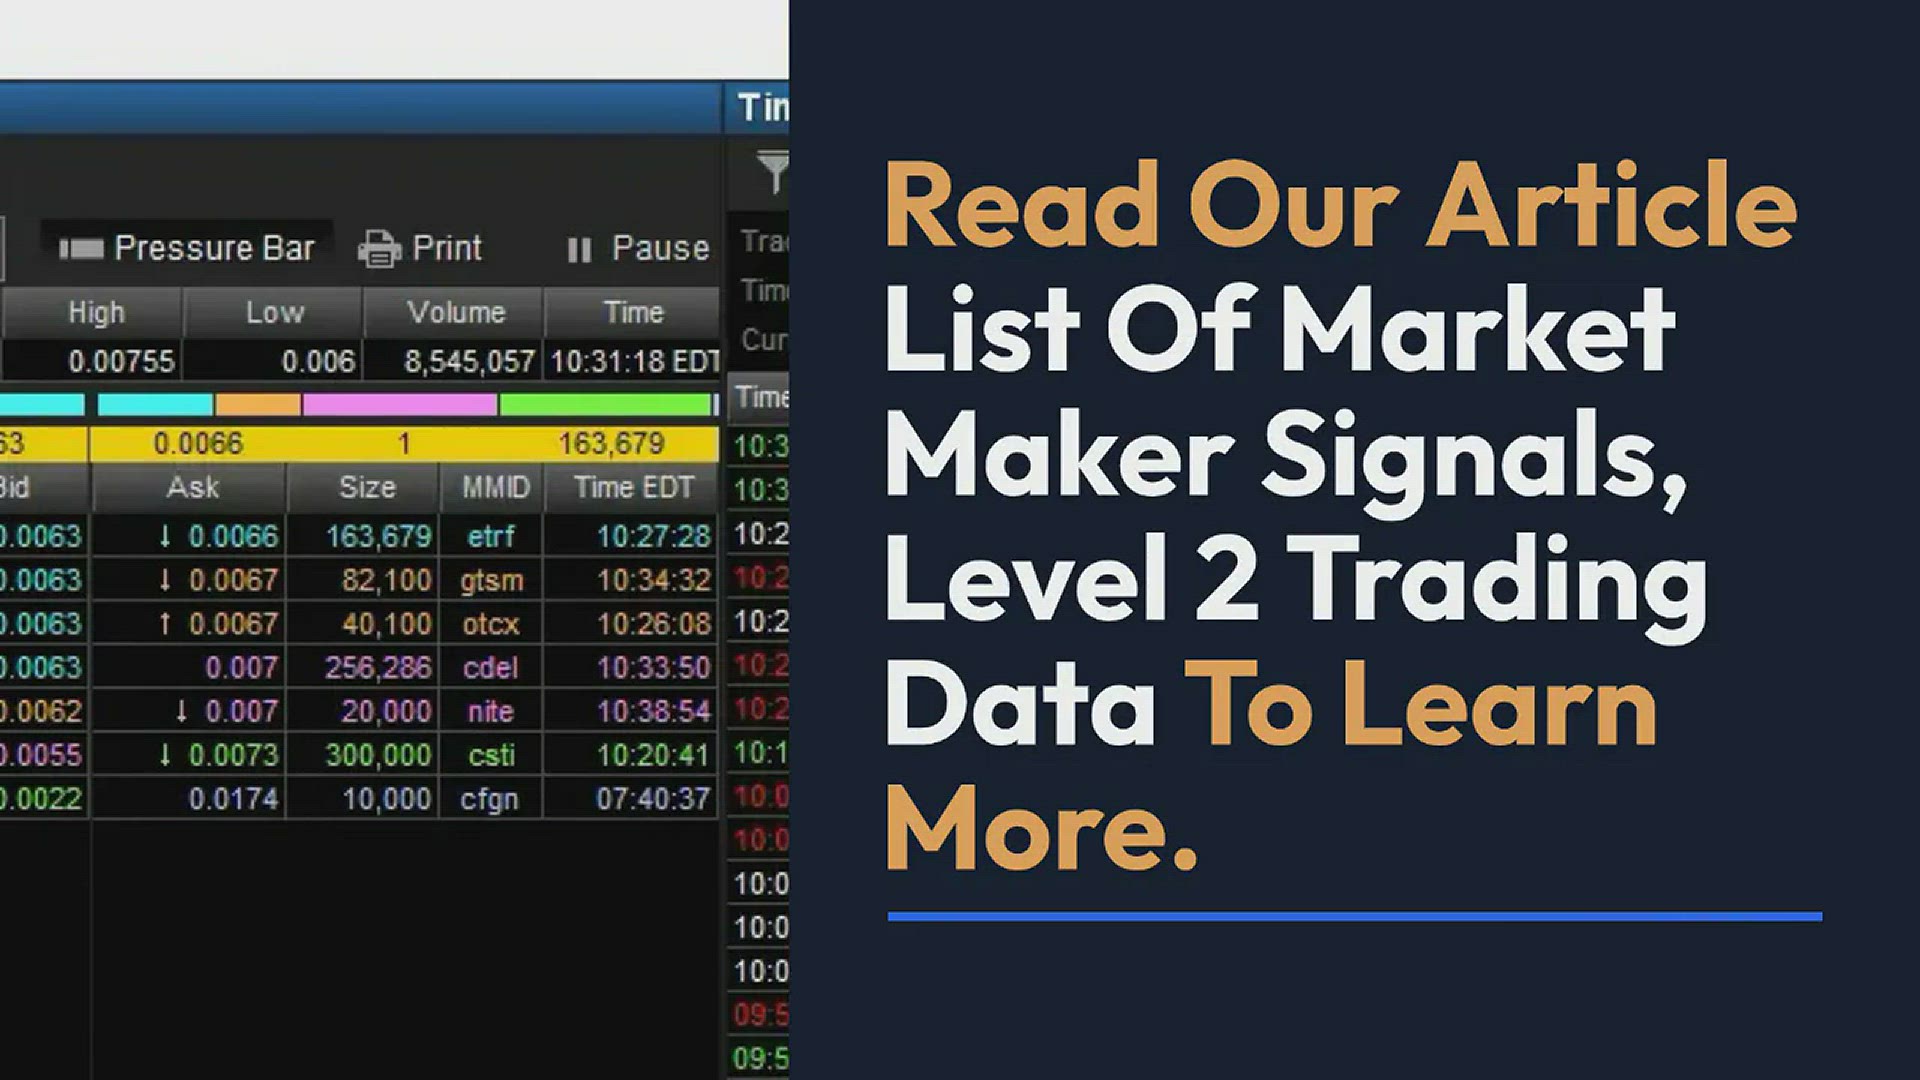
List Of Market Maker Signals, Level 2 Trading Data
8K views · Dec 22, 2021 otc.financial
What are market maker signals? Market maker signals are the signs broker-dealers or market makers send each other to move stock prices. You can see all of the buys and sell share amount orders in real-time during trading hours when the markets are open, making it easier to figure out what’s going on with the direction of a company’s share price.
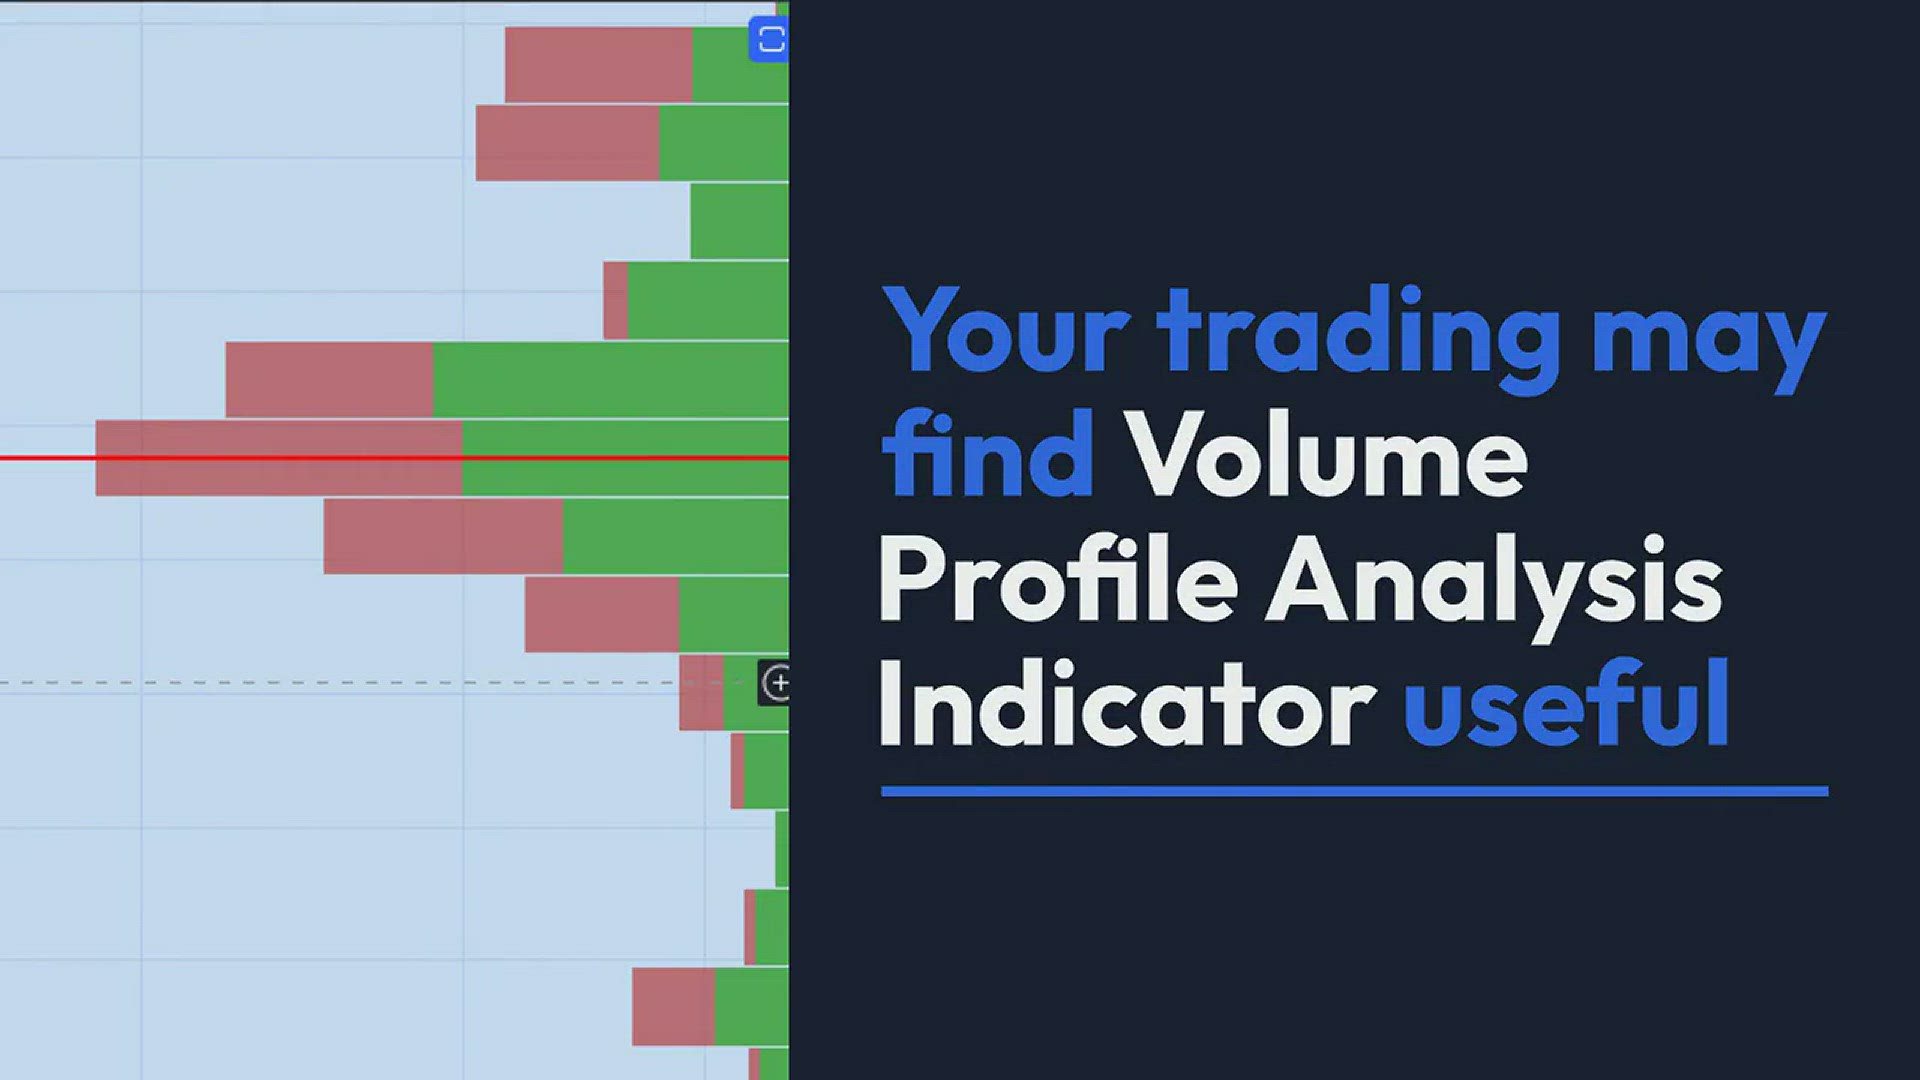
Volume Profile Analysis Indicator (VPVR Indicator Tradingvie...
3K views · Dec 23, 2021 otc.financial
Volume Profile Analysis Indicator (VPI) is a volume-based indicator calculated by taking the volume of shares traded in price range and plotting it on a stock chart graph. The VPI is one of the indicators used to find support and resistance pressure levels. It can also be used to reveal breakouts, continuation patterns, early indications of trend changes, and more.
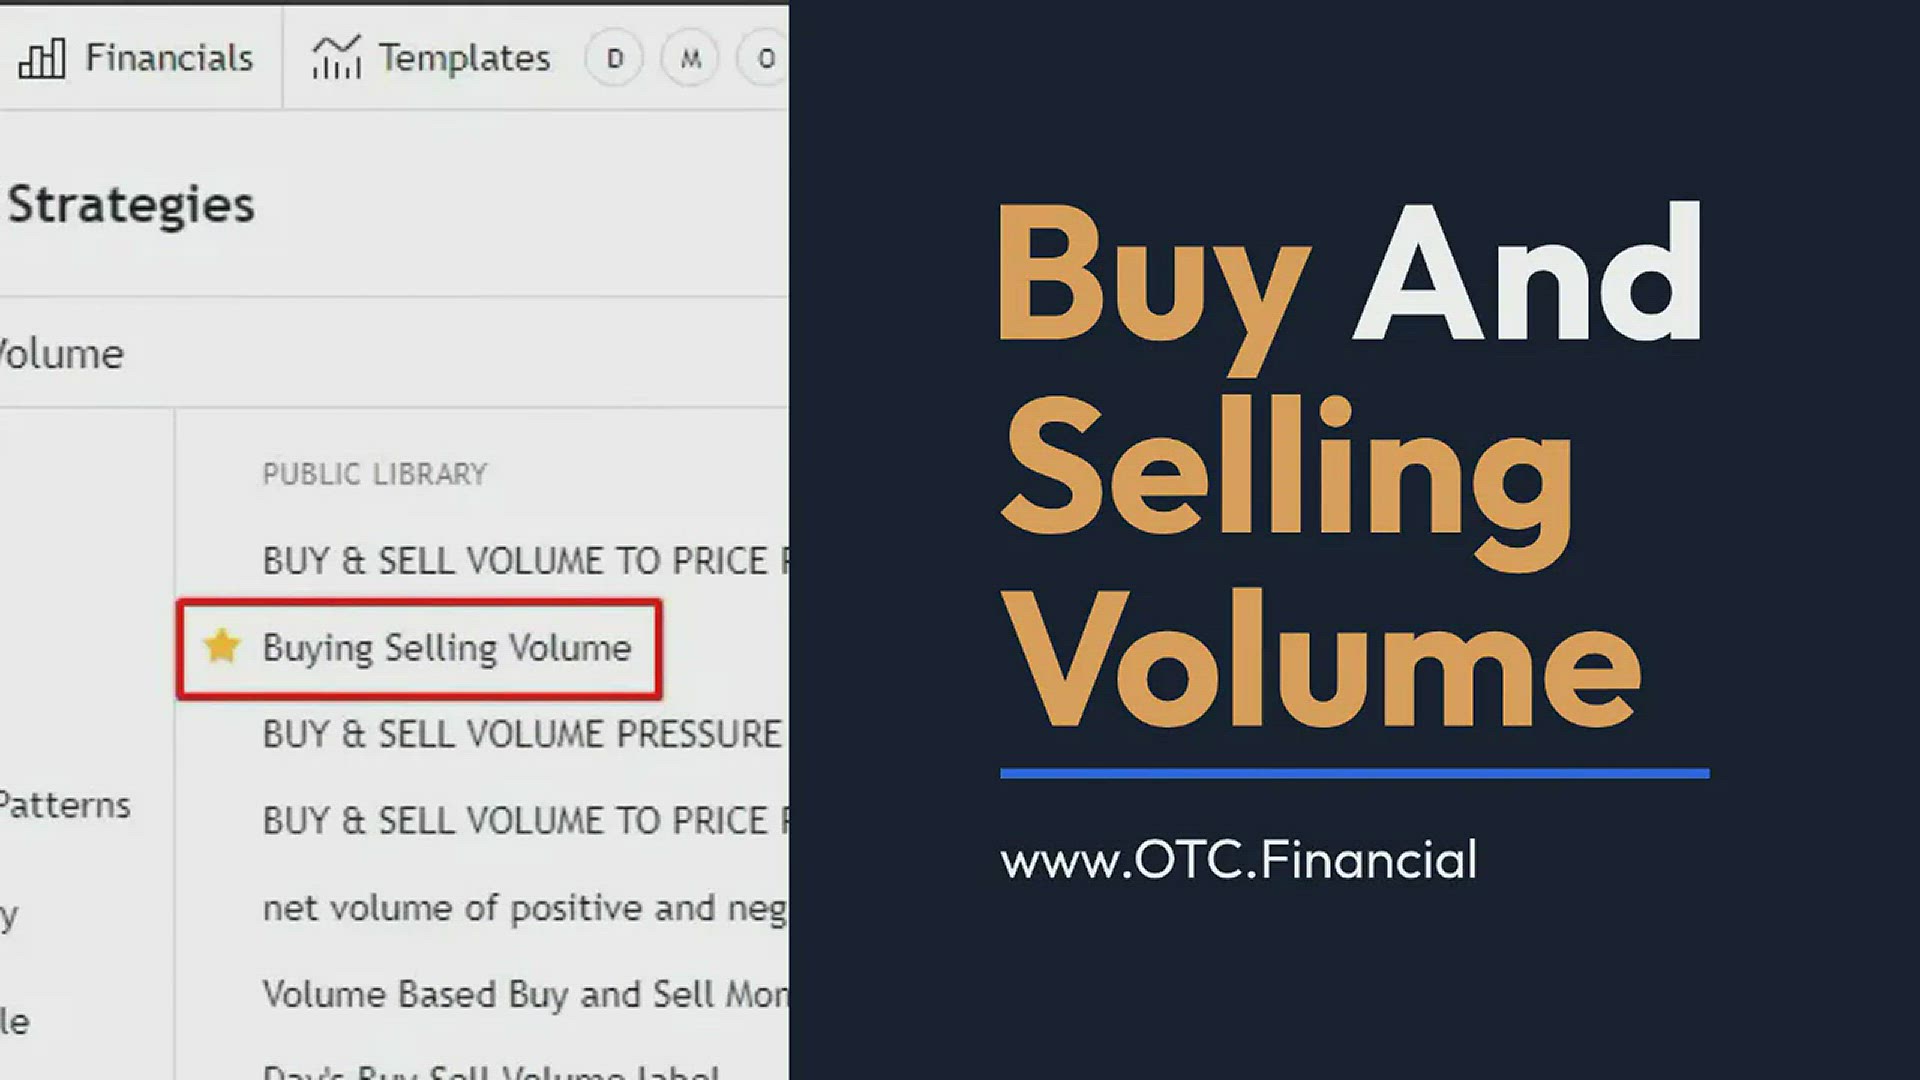
Buy And Selling Volume Indicator
2K views · Dec 28, 2021 otc.financial
The Buy And Sell Volume Trading Indicator is your charts’ free trading volume indicator. It’s the perfect tool to help you find hidden trading opportunities and make more money in the market. The Trading Indicator will show you when large buy or sell orders are coming into the market, signal a potential price change. This means that if you’re looking for an opportunity to enter a trade, this is one of your best tools! It can help you track the supply vs. demand of stock being traded.
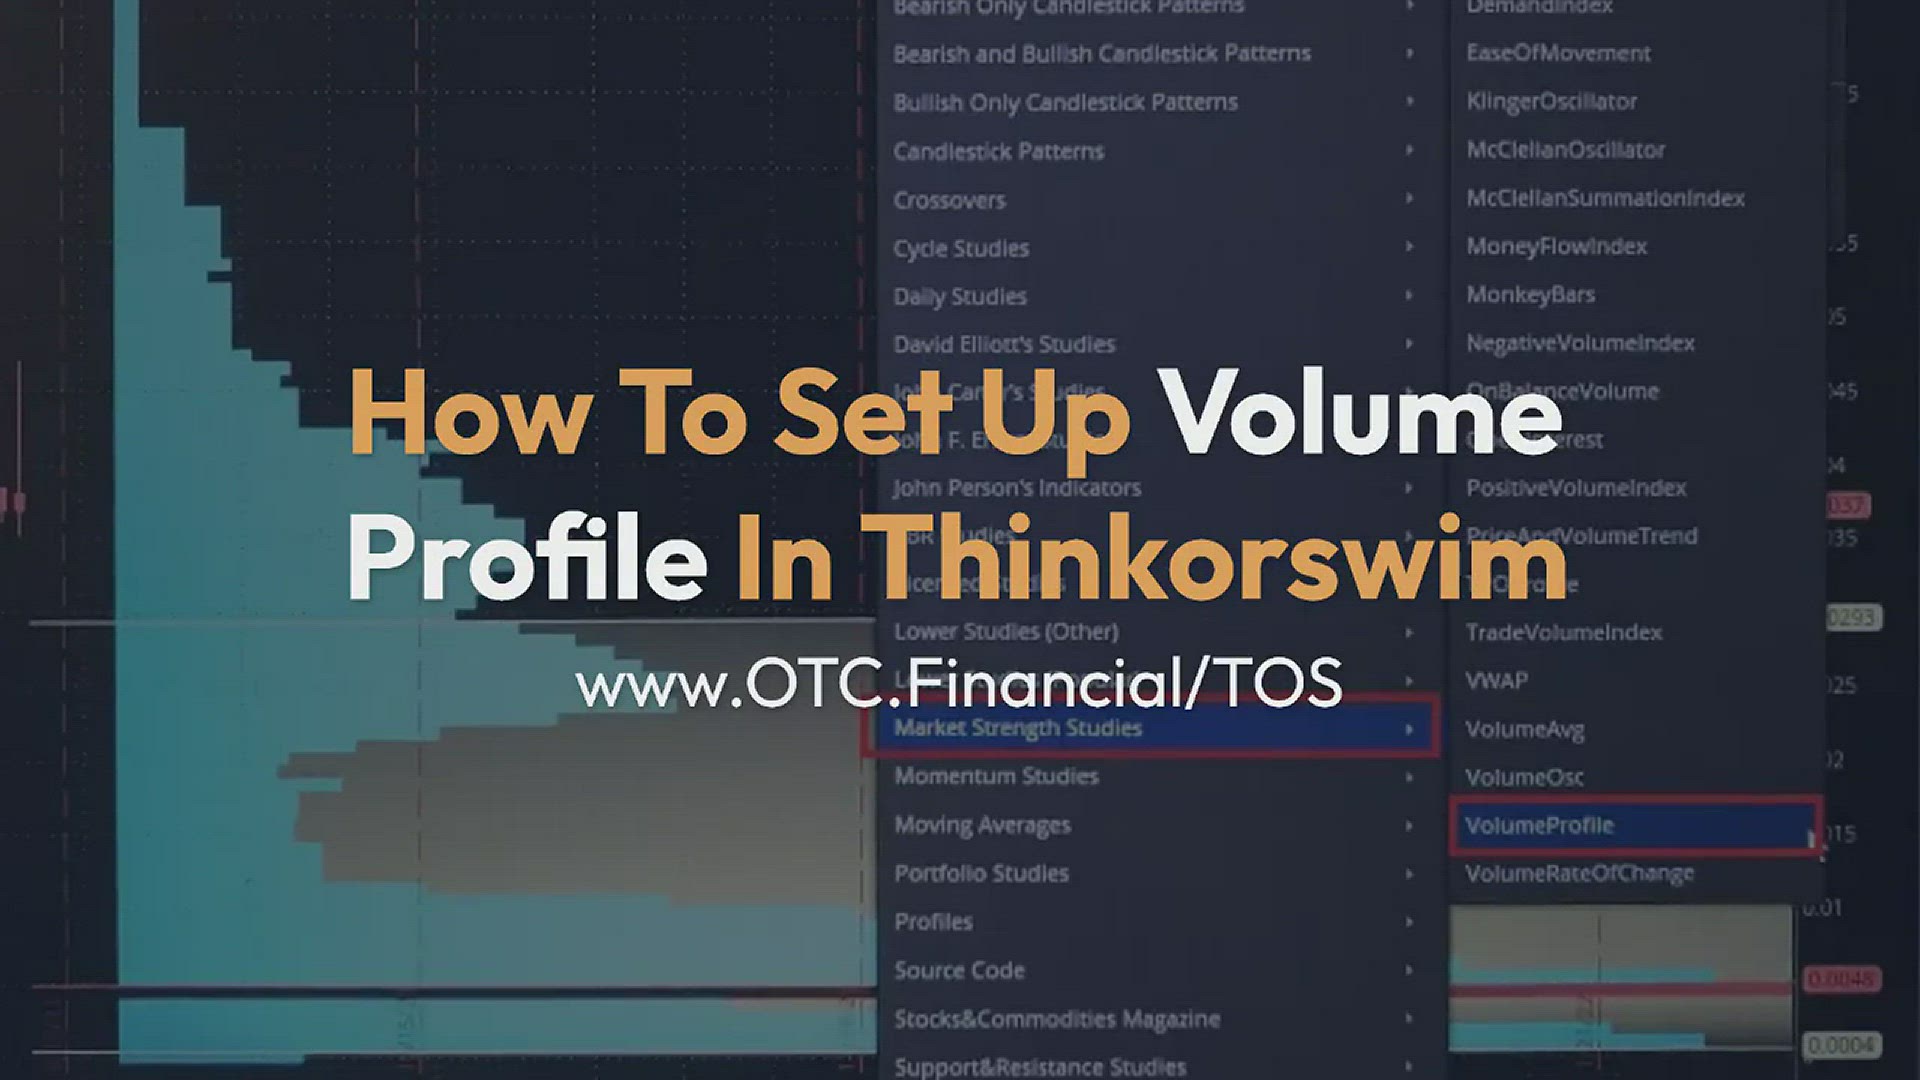
How To Set Up Volume Profile In Thinkorswim TOS
2K views · Dec 29, 2021 otc.financial
Volume Profile is a powerful indicator that will show you where volume is concentrated. Thinkorswim includes Volume Profile as one of its default charts. Volume Profile can also be used to identify areas of support and resistance. In conjunction with other indicators such as price movement, trend lines, and other technical indicators, the volume profile provides the trader with a complete picture of the trading environment. It can also be used to reveal breakouts, continuation patterns, early indications of trend changes, and more.
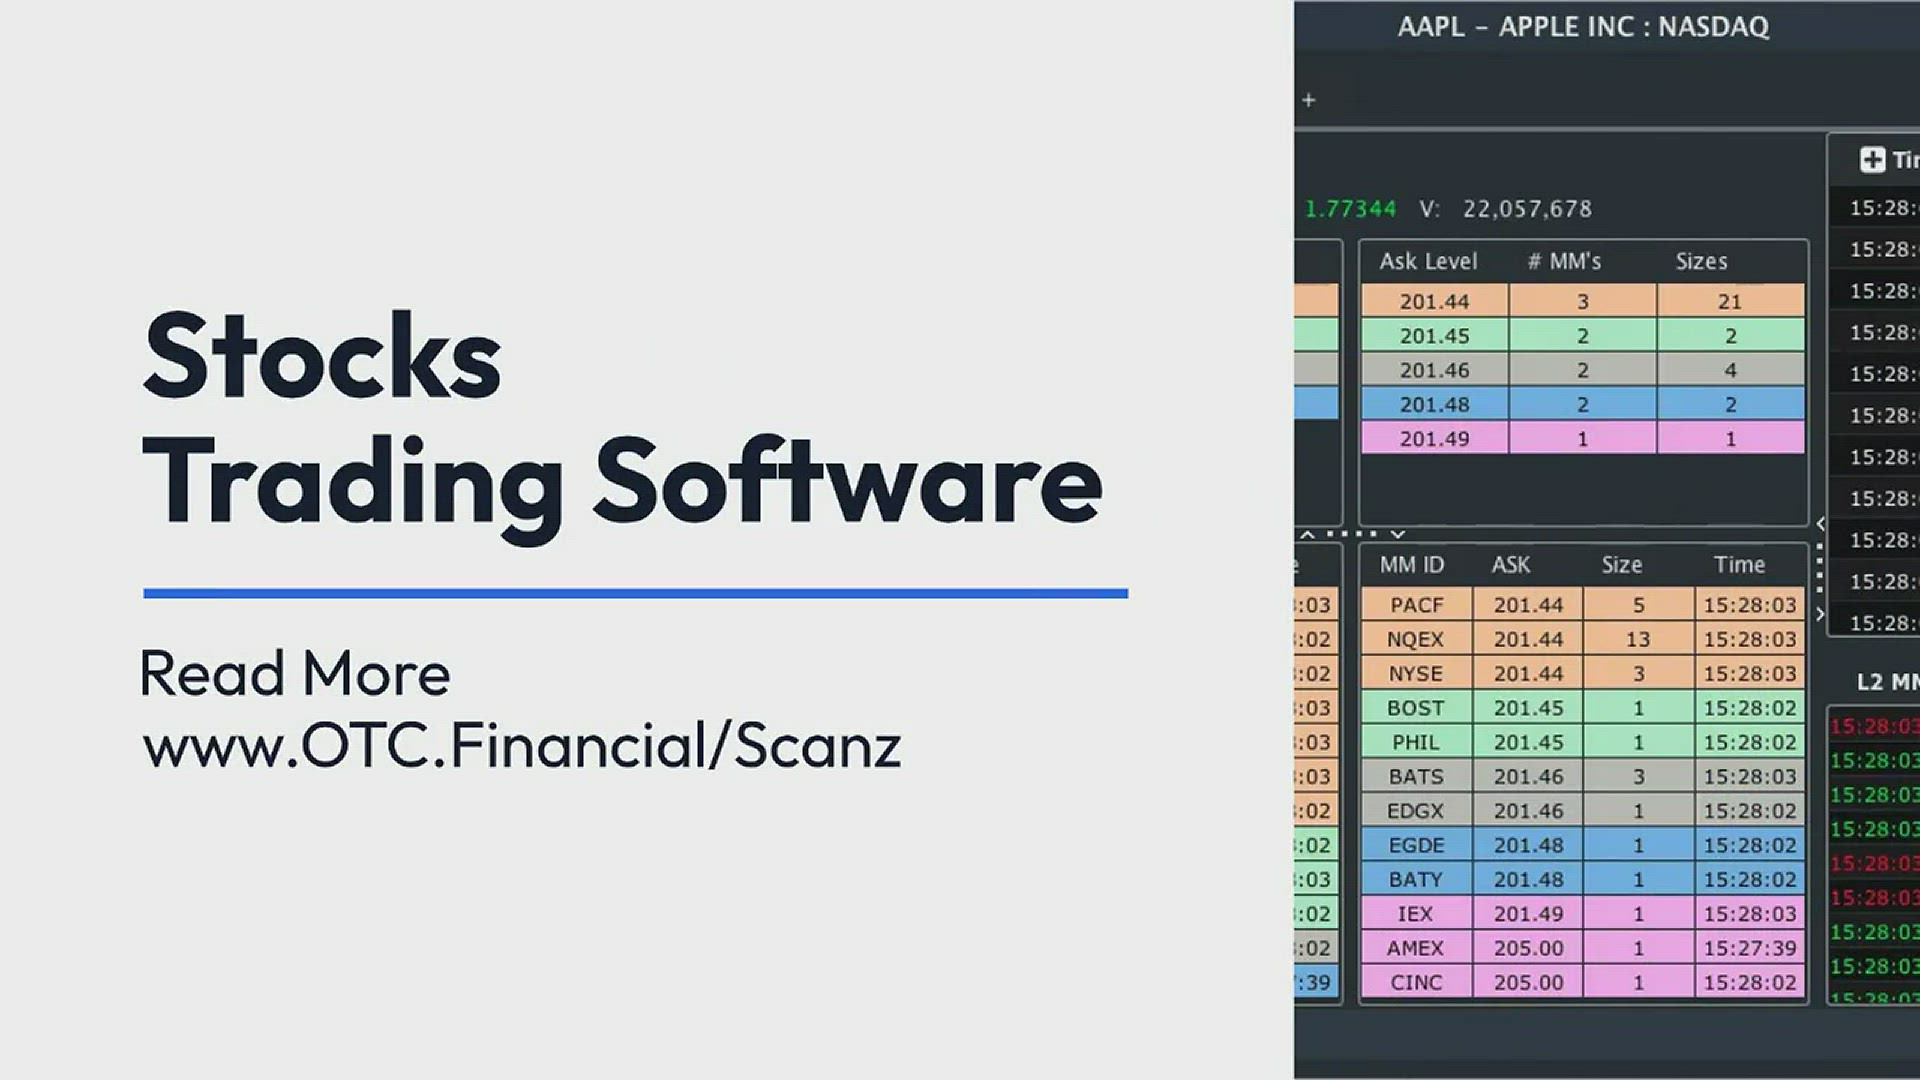
Scanz Stocks Trading Software Review
2K views · Dec 29, 2021 otc.financial
Download Scanz stocks trading software that includes market maker level 2 quotes, beautiful charts, technical indicators, and delivers fast market news. Scanz is a stock trading software that will help you maximize your profits, minimize your losses, and manage your portfolio. Scanz is the best software for novice and experienced traders alike. If you want to invest your money, it’s essential to know what stocks are the best. Scanz is software that helps you scan your stocks and then advise what to do next. Scanz software program is a stocks software that enables you to track your stocks, and if you have linked your broker account to trade from inside the software, it will also calculate your gains and losses.